044 209 91 25 079 869 90 44
Notepad
The notepad is empty.
The basket is empty.
Free shipping possible
Please wait - the print view of the page is being prepared.
The print dialogue opens as soon as the page has been completely loaded.
If the print preview is incomplete, please close it and select "Print again".

R Graphics

BookHardcover
Ranking52106inInformatik EDV
CHF109.00

Description

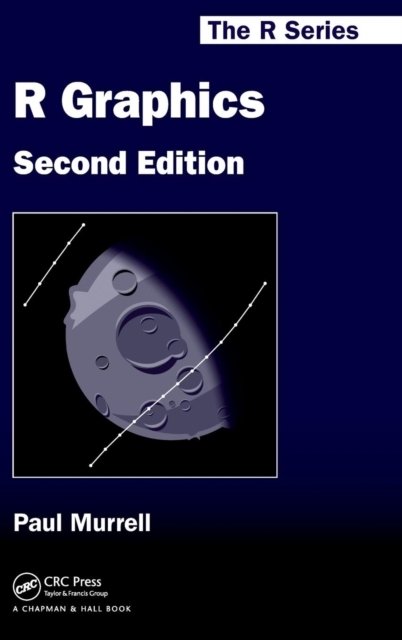
Written by the foremost authority in the field, this book explains how to use R to produce high quality statistical graphics. Completely updated and revised, this second edition highlights new graphics-related packages that have been developed, such as the ggplot2 package. A number of new chapters cover these packages in detail. Other chapters new to this edition feature discussions of interactive graphics, 3D graphics, and importing graphics. The book also includes new examples as well as enhanced exercises for teaching or self-study.
More descriptions

Details

ISBN/GTIN978-1-4398-3176-2
Product TypeBook
BindingHardcover
Publishing date01/07/2011
Edition2. A.
Pages546 pages
LanguageEnglish
SizeWidth 156 mm, Height 235 mm
Weight907 g
Illustrationss/w. Abb.
Article no.11267598
CatalogsBuchzentrum
Data source no.10549856
Product groupInformatik EDV
More details

Series

Author

Paul Murrell attended Auckland University for his BSc (in Computer Science), BA (in Psychology), MSc (in Psychology), and PhD (in Statistics!). He then spent a year at the University of Cambridge in the Department of Community Medicine as a medical statistician and research assistant, before joining the Department of Statistics at Auckland University in October, 1999. His research interests include computational and graphical statistics. He is currently part of the development team for the R and Omegahat statistical computing projects. He was elected a Fellow of the American Statistical Association in 2010.